


Historicals keyed by hand
Years of reported numbers typed from filings, for the company and for every peer.
Needl.ai pulls the historicals and comparables you name out of the filings, with a source on every figure. It reads your models however they are laid out, answers questions with the cells cited, and checks each number against the documents behind it.
Before an analyst writes a word, the numbers go into a spreadsheet: historicals keyed from annual reports and transcripts, comparables gathered from a stack of peer filings. None of it is the analyst's edge. It is where wrong numbers enter, and once one is in, everything downstream inherits it.
Years of reported numbers typed from filings, for the company and for every peer.
When a reviewer asks where a number came from, the answer is another search through the filings.
Checking a model you did not build means re-reading every document behind it.
The analyst keeps the structure, the assumptions and the view. Needl.ai does the work around the numbers: finding them, citing them and checking them.
Name the companies and the metrics, and the figures come back in a table, each with its source.
Several tables on a sheet, merged headers and subtotal rows are read the way an analyst reads them.
Ask the model a question, and every figure in the answer names the sheet and cells it came from.
Each figure is set against the filing it should match, with the gap shown where they differ.
How the numbers move through Needl.ai, from the documents your team trusts to a model any reviewer can trace.
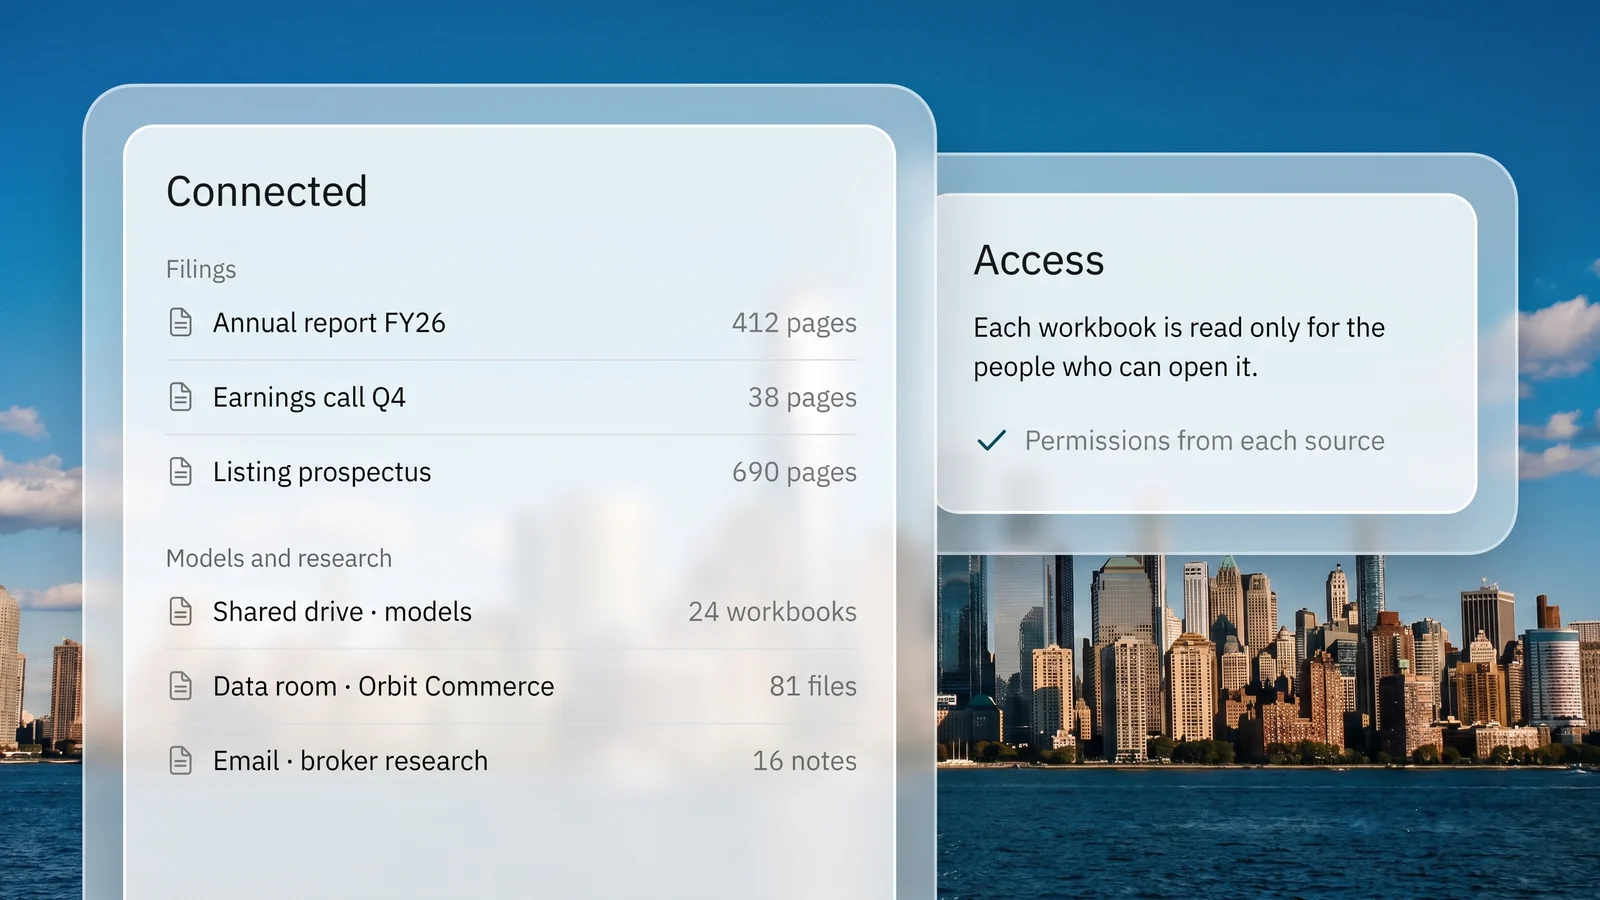
Annual reports, earnings calls and prospectuses are connected alongside the drives, data rooms and email where your models and broker research live. Access follows the permissions in each source system.
You getThe filings and the models in one place.
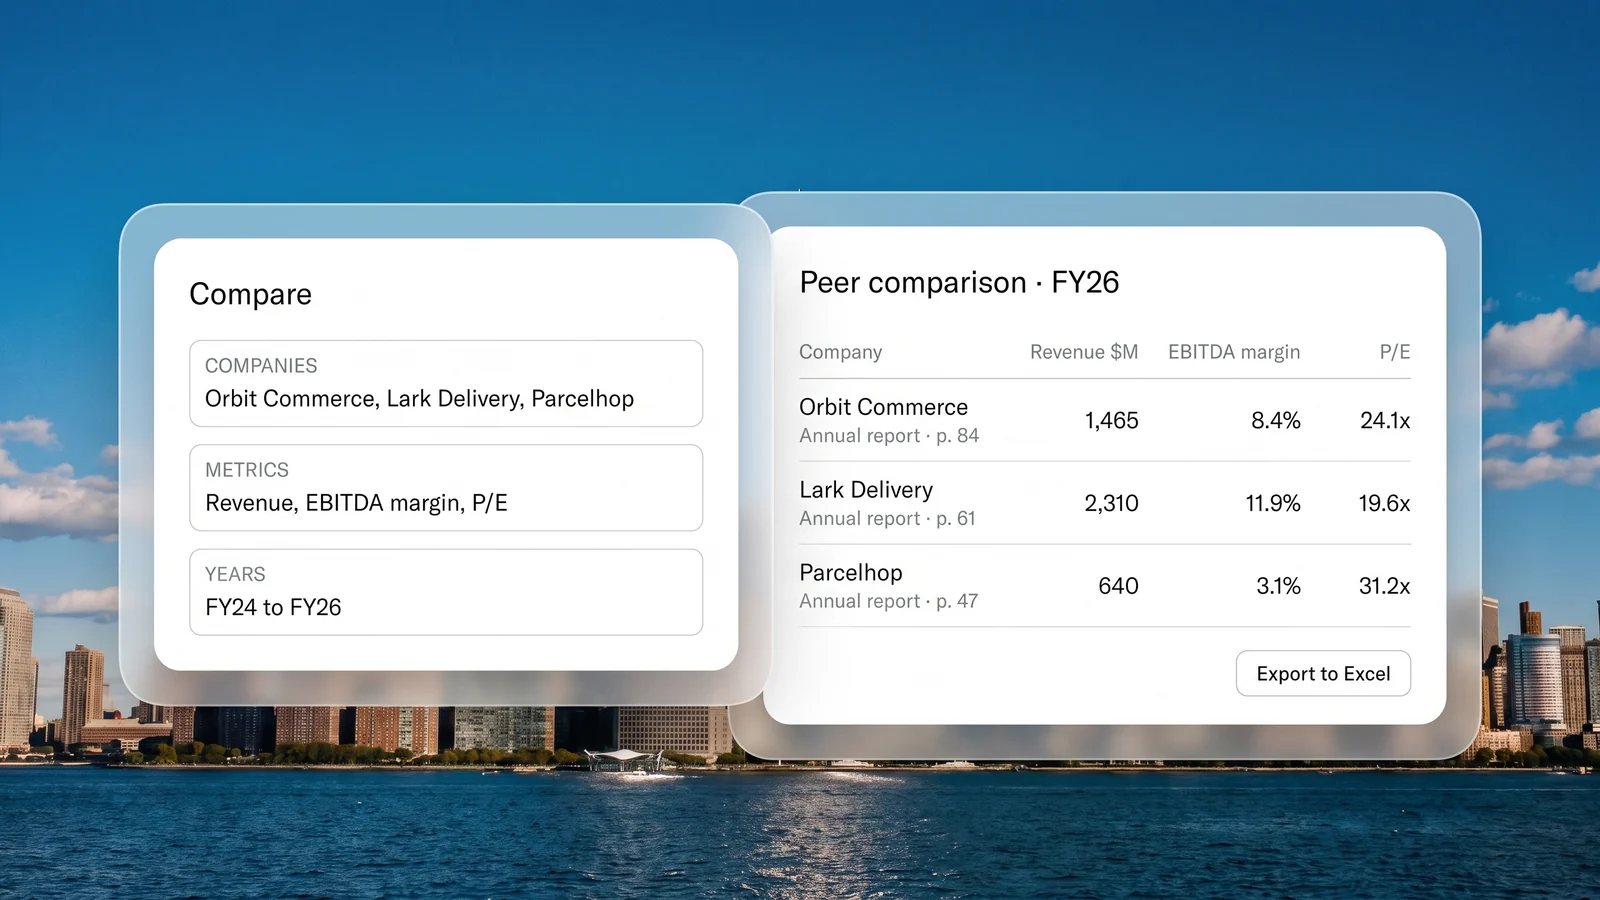
Name the companies, the metrics and the years, such as revenue, EBITDA margin and P/E for FY24 to FY26. The figures come back as a table with a source on each, and export as an Excel workbook.
You getHistoricals without the typing.
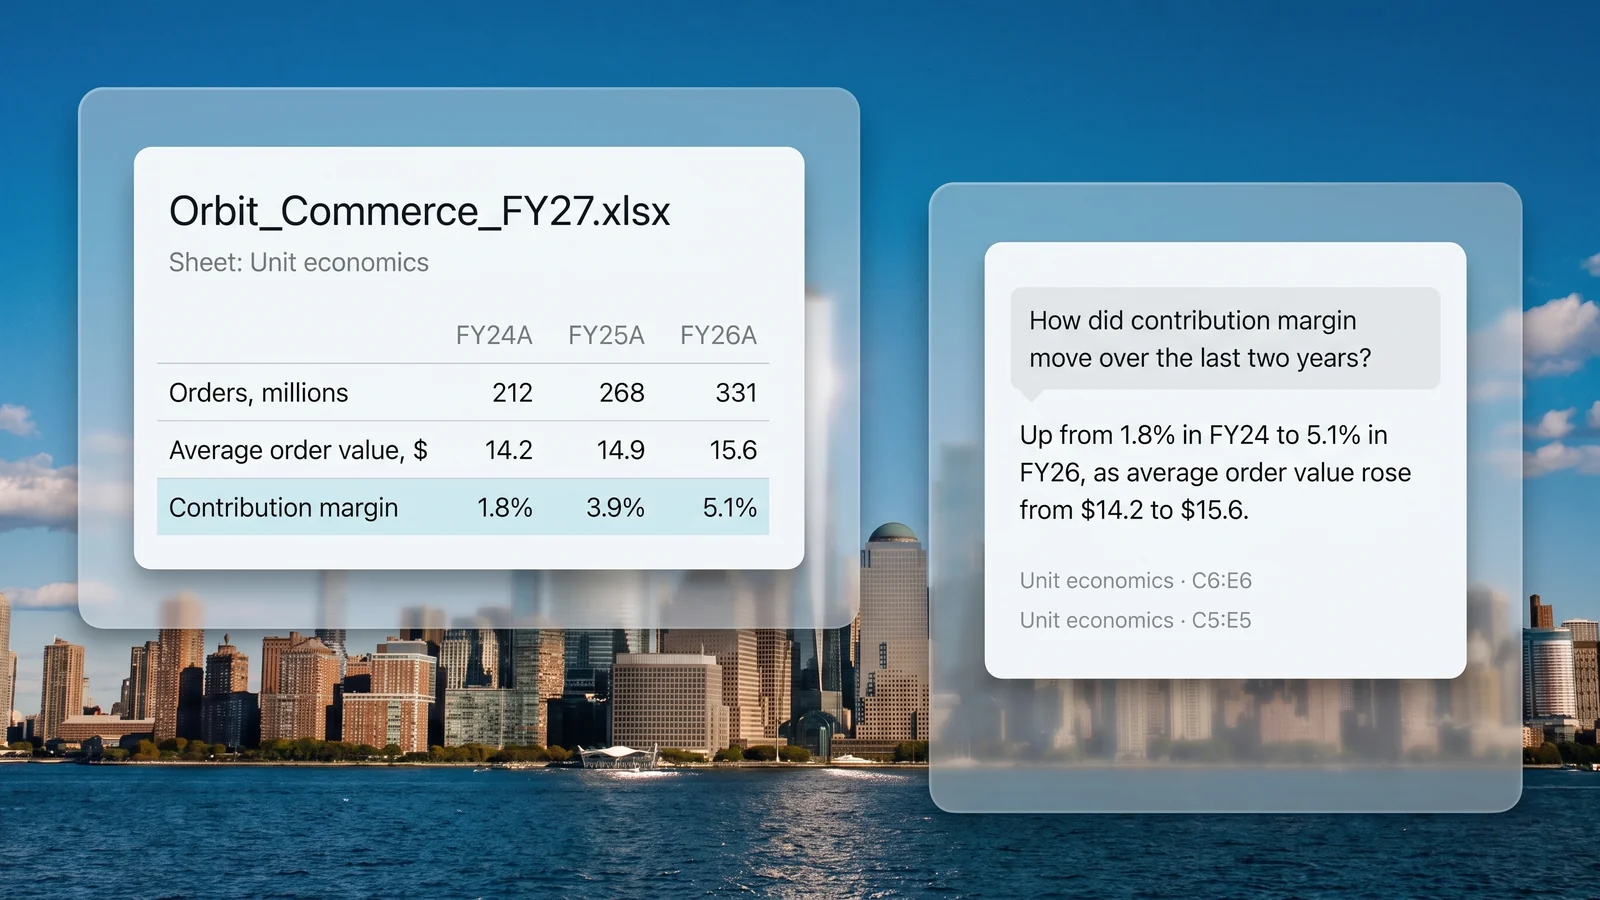
Needl.ai reads the workbook however it is laid out and answers in figures, each citing the sheet and cells it came from. Margins, coverage and leverage are calculated and shown with their inputs.
You getAn answer you can check in the cell.
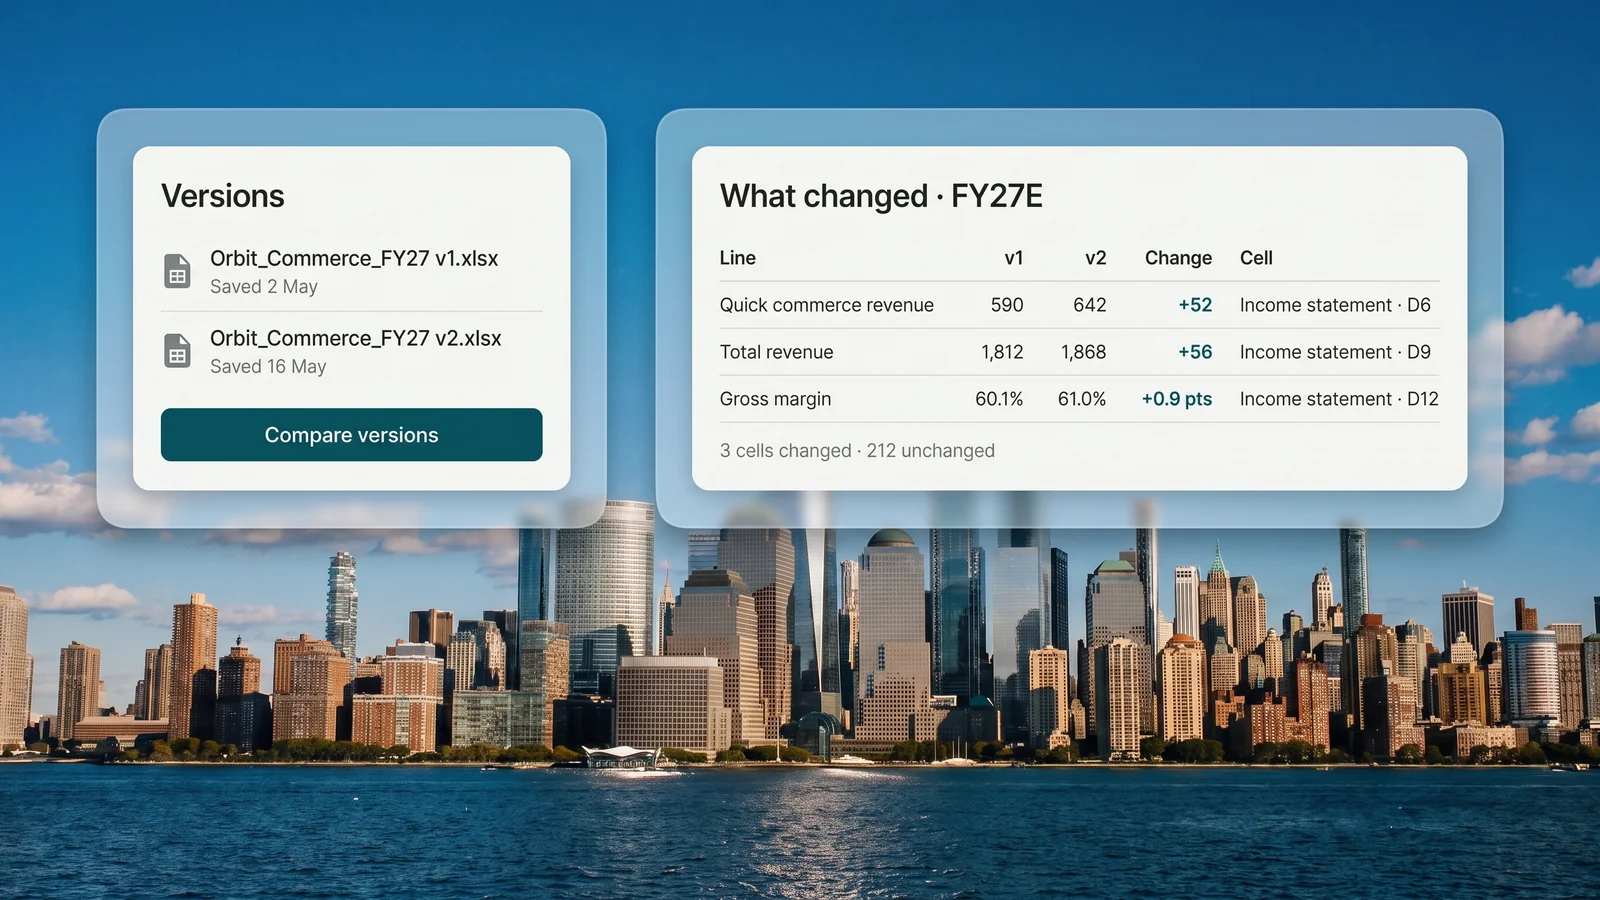
Put two versions of a model, or a model and its peers, into one question. The answer shows what moved, by how much, and in which cells.
You getEvery change between drafts, with its cells.
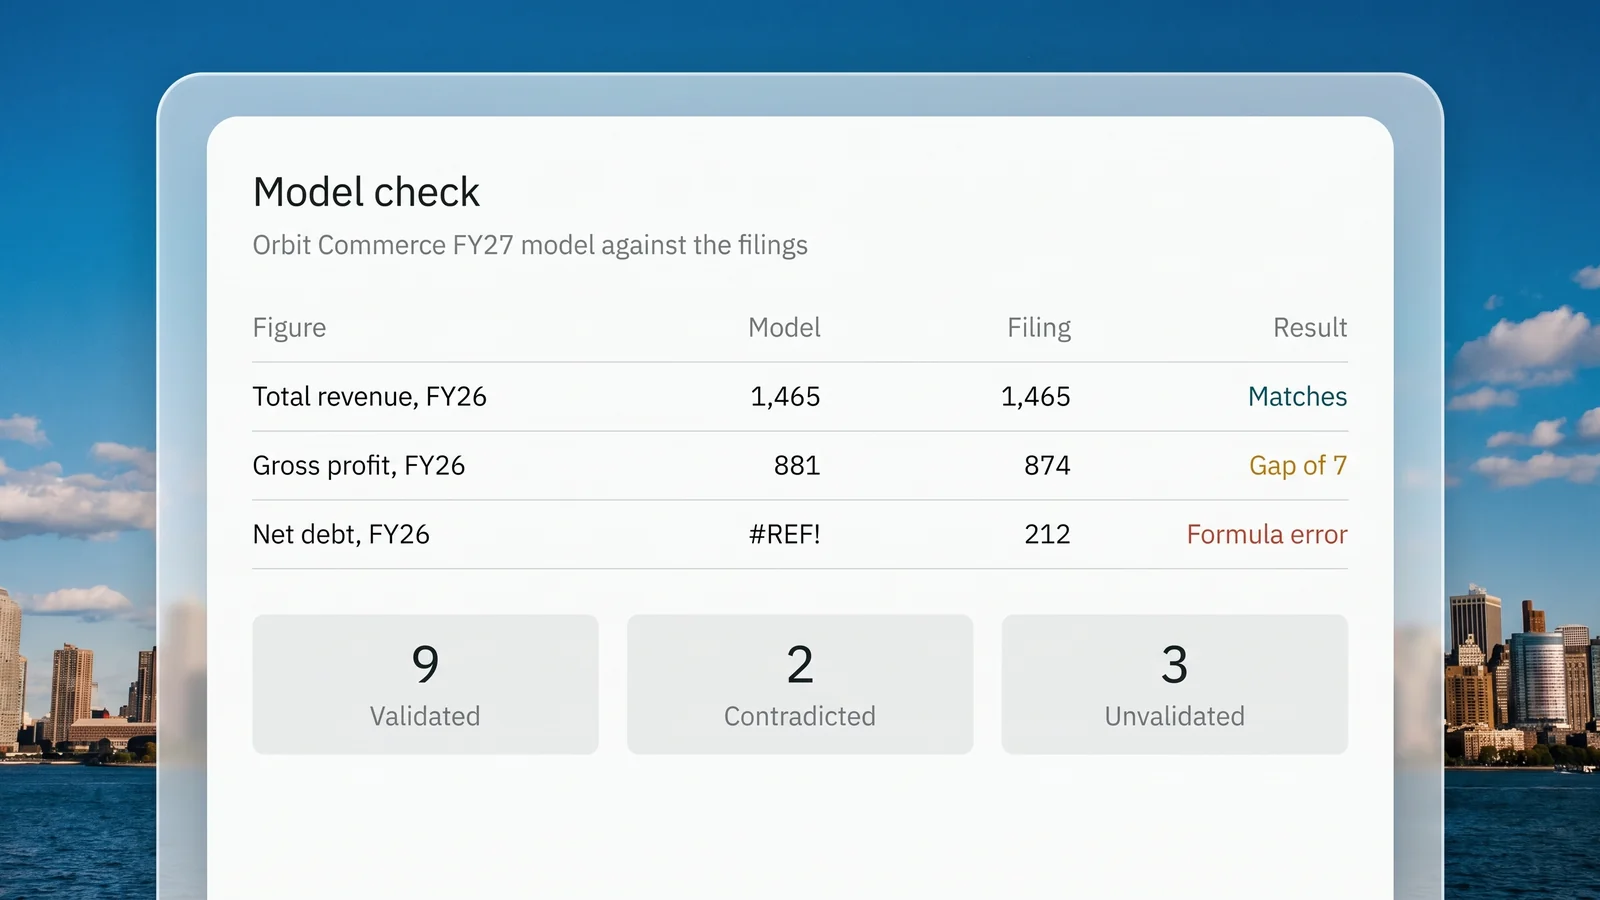
Each figure is set against the filing or document it should match, with both numbers and the gap. Assumptions are marked validated, contradicted or unvalidated, and cells showing formula errors are called out.
You getThe gaps, found before the review.
Every figure keeps its source, whether it came from a filing, a workbook or a calculation, so a review starts from evidence.
Each figure names the filing and page, or the workbook, sheet and cells, it came from.
Several tables on one sheet, merged headers, notes and subtotal rows, read without reformatting.
P/E, EV/EBITDA and margins for the companies you name, side by side in one table.
Margins, coverage, leverage and growth are calculated and shown with the figures they came from.
Cells that show an error such as #REF! or #DIV/0! are pointed out in the answer.
A figure from a filing and a figure from a model can meet in the same calculation.
Tables export as a structured workbook, so the numbers land where the desk works.
A later question about the same workbook starts from the tables already read.
Only the files each person can already open are read for them.
“We stopped second-guessing the output. Almost every answer comes back with a citation we can open and verify, so a review that used to take hours now takes minutes.”
Needl.ai can be deployed in your own AWS or Azure account, in your region, and every answer follows the permissions already set in each source system.
 AICPA SOC 2
 ISO 27001 certified
 ISO 42001 in progress
 GDPR compliant
 CASA assessed
What research and investment teams ask before bringing their models to Needl.ai.
Your analysts. Needl.ai supplies the sourced historicals and comparables as an Excel workbook, and reads, compares and checks the models your team builds. The structure, the drivers and the forecast stay with the analyst.
Yes. Workbooks are read as they come, with several tables on a sheet, merged headers and subtotal rows, whether they are uploaded or sit in the drives and data rooms you connect.
Each figure names where it came from: the filing and page, or the workbook, sheet and cells. Figures that are calculated are shown with the inputs they came from.
It says so. A figure with no source to cite is reported as unsourced, and is never given a citation it does not have.
No. Needl.ai reads a copy of the file, so your workbook stays exactly as you saved it.
In your own AWS or Azure account, in your region, or in Needl.ai's cloud to start.
Bring a model and the filings behind it, and see every figure traced and checked on your own documents.